HTML5 Canvas
In this HTML5 canvas tutorial you will be able to learn:
- The coordinates system of the canvas
- How to draw basic shapes
- How to fill the shapes with a colour of your choice
Finding a good book to master HTML5 can be very challenging: there are so many around - most with eye-catching titles and very complex substance.
Therefore,
Vivax Solutions strongly recommends
Core HTML5 Canvas for those who really want to delve into HTML5.
Please click the image to access
Amazon:
The main drawing element in HTML5 is canvas; it is where we draw or animate images.
The <canvas></canvas> Element
The new canvas element is providing us with a container to draw graphical objects, with the aid of JavaScript. The images are produced on the canvas by the code written in JavaScript within <script></script> tags.
This is a 400 X 300 canvas element.
The blue border is produced by CSS.
The code is as follows:
<canvas id="Canvas_Two" width="400" height="300" style="border:5px dashed #0000FF;">
</canvas>
Then, the canvas and its graphic drawing object, getContext() must be referred to in JavaScript as follows:
var c=document.getElementById("myCanvas");
var ctx=c.getContext("2d");
2d indicates the use of element for 2-D graphics.
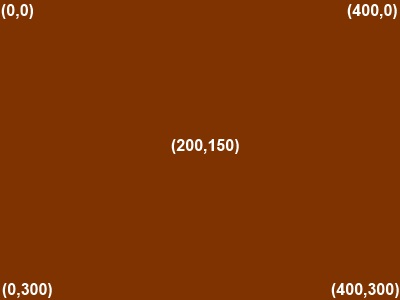
The Coordinate System of Canvas

Now, let's draw some shapes on the canvas. The full source code for the shapes are given below the drawing.
Circle, Line, Arc, Rectangle, Line-Join
As you can see, it is fairly simple to draw shapes on the canvas provided that you have a clear idea about the coordinate system of the canvas.
The Code for the above Shapes:
<script type="text/javascript">
var cv = document.getElementById('Canvas_Two');
var cnt = cv.getContext('2d');
//--------------------------------------code for the line---------------
// begin the task
cnt.beginPath();
// initial point
cnt.moveTo(200, 150);
// final point
cnt.lineTo(300, 50);
// colour for the line
cnt.strokeStyle = "green"
// line width
cnt.lineWidth = 5;
// command for drawing
cnt.stroke();
//---------------------------------------- code for the circle------------
// begin the task
cnt.beginPath()
// coordinates of the centre(x,y), radius, initial angle and final angel in radians, anticlockwise=false
cnt.arc(100, 70, 60, 0, 2 * Math.PI, false);
context.lineWidth = 2;
// color for the circle in Hexadecimal form
cnt.strokeStyle = '#0000FF';
cnt.stroke();
//-----------------------------------------code for the arc-------------------
// begin the task
cnt.beginPath();
// coordinates of the centre(x,y), radius, initial angle and final angel in radians, anticlockwise=false
cnt.arc(100, 200, 60, 0, 0.5* Math.PI, false);
context.lineWidth = 2;
cnt.strokeStyle = '#FF00FF';
cnt.stroke();
//<-------------------------------------------code for the rectangle-------
// begin the task
cnt.beginPath()
// coordinates of the initial point(x,y), width and height
cnt.rect(300, 100, 80, 50);
context.lineWidth = 2;
cnt.strokeStyle = '#FFFF00';
cnt.stroke();
//-------------------------------------------code for the line-meeting--------
// begin the task
cnt.beginPath();
//line one
cnt.moveTo(230, 225);
cnt.lineTo(350, 280);
// line two
cnt.lineTo(280, 150);
// join the line: it could be miter, round or bevel
cnt.lineJoin = 'miter';
cnt.strokeStyle ='#00FFFF';
cnt.stroke();
</script>
Drawing Custom Shapes and Filling
The context.lineTo() object - and other drawing objects - can be used to draw complex diagrams on the canvas.
The following shows how a regular hexagon is drawn on the canvas and then painted.
The Code for Filled Hexagon
<canvas id="Canvas_Four" width="400" height="400" style="border:5px solid red"></canvas>
<script>
var canvas = document.getElementById('Canvas_Four');
var cnt = canvas.getContext('2d');
context.beginPath();
//code for the six sides of the hexagon - use Pythagoras' Theorem with coordinates for calculations
cnt.moveTo(135, 80);
cnt.lineTo(265, 80);
cnt.lineTo(315, 200);
cnt.lineTo(265, 320);
cnt.lineTo(135, 320);
cnt.lineTo(85, 200);
cnt.closePath();
cnt.fillStyle = "blue";
cnt.fill();
cnt.lineWidth = 10;
cnt.strokeStyle = 'lightblue';
cnt.stroke();
</script>
In order to make sure all six sides are equal, Pythagoras' theorem is used in determining the exact coordinates:
c2 = a2 + b2.
All Canvas Animations