Data Handling: Cumulative Frequency, Quartiles and IQR
Cumulative Frequency
The marks obtained by a group of students for maths are as follows:
| Marks (x) | frequency (f) |
| 0 - 20 | 3 |
| 21 - 40 | 6 |
| 41 - 60 | 9 |
| 61 - 80 | 8 |
| 81 - 100 | 4 |
Now, we can rearrange the table with a running-total as frequency. This frequency is called cumulative frequency. A cumulative frequency table consists of classes
up to a certain upper value and cumulative frequencies, which takes the following form.
| Marks (x) | cumulative frequency (f) |
| up to 20 | 3 |
| up to 40 | 9 |
| up to 60 | 18 |
| up to 80 | 26 |
| up to 100 | 30 |
Now you can plot a graph to represent the above data and it looks like the following:
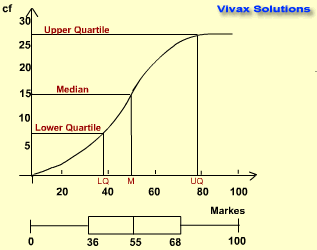
From the graph, we can find the the following:
- Lower Quartile - the class value for the 1/4th cumulative frequency = 36
- Median - the class value for the 1/2 of the cumulative frequency = 55
- Upper Quartile - the class value for the 3/4th cumulative frequency = 68
- Inter Quartile Range - the difference between the quartiles - 68 - 36 = 32
Now, we can draw a box plot; it shows the minimum-value, LQ, Median, UQ and maximum value in that order as shown in the image.
Practise Box Plots - interactive
A box-plot shows the minimum value, Q1, median, Q3 and the maximum value in that order.
With the following applet, you can see how a box plot is created with a set of data. Just click the button to get a new set of data and see how the box-plot is formed. You may have to move the grid to see the full box-plot.
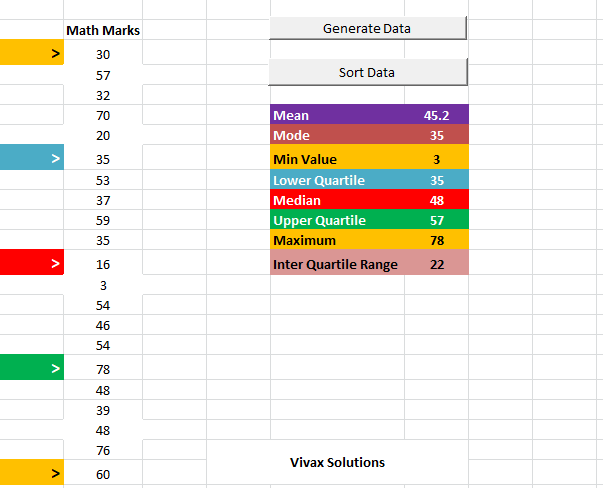
Averages and Spread of Data with Excel
In the following animation, a set of random data is generated with Excel and then averages and spread of data are calculated - automatically.
Practise Cumulative Frequency - interactive
With the following applet, you can practise cumulative frequency interactively. With each click, a new dataset is created and the cumulative frequency curve is updated accordingly. You can see the quartiles and the median being updated too. The set of data gives the marks obtained by a group of students in a certain test.
Now, in order to complement what you have learnt so far, work out the following:
- The time taken for a certain test by a group of students are is as follows:
| Marks (x) | frequency (f) |
| 11 - 20 | 3 |
| 21 - 30 | 7 |
| 31 - 40 | 18 |
| 41 - 50 | 5 |
| 51 - 60 | 2 |
Find the following:
- the median
- quartiles
- IQR
- the pass mark, if 4/7th of the students are passed
- the number of students who scored more than 50
- The time taken by 25 kids to finish their lunch, in minutes, is as follows:
8, 9, 7, 11, 7, 12, 15, 9, 9, 10, 11, 17, 16, 10, 11, 6, 19, 12, 17, 15, 16, 12, 13, 13, 17
Construct an appropriate grouped-frequency table for this data and then plot a cumulative frequency graph for the same. Then calculate the
mean, median, quartiles and IQR for the data.
This is how these cubes work:
Now that you have read this tutorial, you will find the following tutorials very helpful too: